> ## Documentation Index
> Fetch the complete documentation index at: https://docs.speckle.systems/llms.txt
> Use this file to discover all available pages before exploring further.
# Calculated fields
> Add your own values to dashboard charts and filters without changing the model.
Calculated fields are in **Beta**. They only exist inside Intelligence dashboards. Speckle does
not save them back into your model. Treat results as something to check carefully — some widgets
do not yet handle every calculated field the same way. Prefer them for exploration and drafts
until you have validated the numbers for your workflow.
**Calculations that run across many elements are easy to misread.** Most calculated fields run
**once per element**. Charts and totals that **Sum** those results can multiply a ratio or an
already-totalled value by the element count — so a “percentage” can look like hundreds of
thousands, and a total can look impossibly large. Before you trust a number: ask whether each step
is one dashboard-level figure (**Dashboard constant**) or a value stamped on every object; prefer
constants (or literals) for shared denominators; and use [Things to watch out
for](#things-to-watch-out-for) and [Debugging and validating
values](#debugging-and-validating-values) when something looks off.
Sometimes the value you need is not already on the model — for example area in a
different unit, a simple “yes / no” label, or a custom group such as “small / medium /
large”.
**Calculated fields** let you create that value once, then use it in charts, tables,
filters, and colour-by — the same way you pick Category or Level.
In this section:
* [Create a calculated field](#create-a-calculated-field)
* [Who can use the field](#who-can-use-the-field)
* [Choose what the field should do](#choose-what-the-field-should-do)
* [Dashboard constants](#dashboard-constants)
* [Use the field in your dashboard](#use-the-field-in-your-dashboard)
* [Build one field on top of another](#build-one-field-on-top-of-another)
* [Things to watch out for](#things-to-watch-out-for)
* [Arithmetic with a per-object denominator](#arithmetic-with-a-per-object-denominator)
* [Ratio filter targeting](#ratio-filter-targeting)
* [Debugging and validating values](#debugging-and-validating-values)
## Create a calculated field
Open a dashboard in **edit** mode. In the left sidebar, open **Calculated Fields**
(calculator icon).
Click **New calculated field**. Give it a clear name (for example “Area in m²” or “Fire door?”).
Choose **Workspace**, **Project**, or **Dashboard**. New fields default to **Dashboard**. Scope
defines where the field lives and which dashboards can reuse it. See [Who can use the
field](#who-can-use-the-field).
Pick a type that matches your goal (maths, grouping, fill blanks, and so on), fill in the
options, then save. The dialog includes a short **How this works** note for each type.
**Dashboard**-scoped fields are available on this dashboard as soon as you save. **Project**-
and **Workspace**-scoped fields appear in **Shared library** until you click **Use on this
dashboard**.
Outcome: The new value is available to pick in widgets and filters, without republishing
the model.
Use a name you will recognise later. If you rename a field, charts and filters that used the old
name need to be pointed at the new name.
## Who can use the field
When you create a calculated field, **Resource scope** sets where the field is defined — not
which dashboard you happened to open first. New fields default to **Dashboard**.
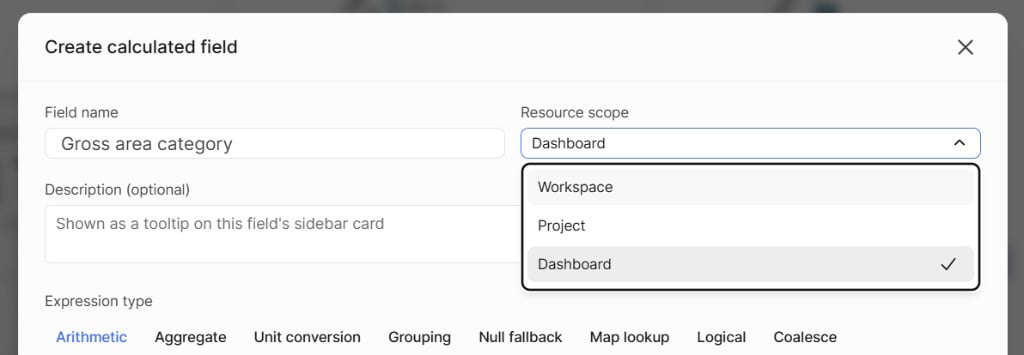 | Resource scope | Where the field is defined | On this dashboard |
| -------------- | -------------------------------------------- | ------------------------------------- |
| **Dashboard** | Only this dashboard (default) | Ready as soon as you save |
| **Project** | Shared across dashboards in the same project | Click **Use on this dashboard** first |
| **Workspace** | Shared across dashboards in the workspace | Click **Use on this dashboard** first |
While calculated fields are in **Beta**, project- and workspace-scoped fields have **no overwrite
protection**. If two people edit the same shared field, the last save wins — there is no merge,
conflict warning, or version history. There is also **no syncing between scopes**: changing a
field’s scope does not keep copies in other scopes up to date, and fields defined at different
scopes stay separate.
* **Remove from this dashboard** — stop using a project- or workspace-scoped field here; it stays in
the library.
* **Delete from library** — remove a project- or workspace-scoped field so other dashboards cannot
use it either.
* **Delete field** — remove a dashboard-scoped field.
## Choose what the field should do
You do not need to know formulas or spreadsheet functions. Pick the option that matches
what you want the dashboard to show.
| I want to… | Choose |
| ------------------------------------------------------------- | ------------------------------- |
| Do simple maths or compare two numbers | **Arithmetic** |
| Get one total, average, or count for the whole set | **Aggregate** |
| Change units (for example feet to metres) | **Unit conversion** |
| Put numbers into labelled ranges (small / medium / large) | **Grouping** → **Range groups** |
| Put text values into custom groups | **Grouping** → **Value groups** |
| Fill in a blank when a property is missing | **Null fallback** |
| Swap a code or name for a friendlier label from a list | **Map lookup** |
| Mark each element as pass or fail with my own labels | **Logical** |
| Try several properties and use the first one that has a value | **Coalesce** |
These names match the tabs in the editor.
### Arithmetic
Add, subtract, multiply, or divide values from the model — for example combine two
areas, or check whether one number is larger than another.
You write a short formula with letters such as `a` and `b`, then tell Speckle which
model property each letter means. If a value is missing, the result is blank.
**Arithmetic works element by element.** If your formula divides a fixed number by a per-object
property — for example `(90000 / Area) * 100` — each element gets its own result. Summing those
per-element ratios gives `value × element count`, not a meaningful percentage.
To get one ratio for the whole dataset:
* Bind the denominator to a **Dashboard constant** aggregate — constants are not stamped
per object, so the ratio stays correct under any aggregation.
* Use the literal value directly: `(90000 / 277795) * 100` — every element gets the same
constant result, and **Average** aggregation returns the correct figure.
* Change the widget aggregation to **Average** when every element genuinely shares the
same ratio.
Arithmetic can also bind [dashboard constants](#dashboard-constants) (scalars) so formulas stay
stable when people filter the dashboard. A **Dashboard constant** Aggregate can source from a
per-object calculated field when you need a masked or conditional total as a scalar. See the
warning above if your formula divides a fixed number by a per-object property.
### Aggregate
Get one figure for the whole data set — for example a total area or an average height —
not a different number on every element.
Choose a **Population**:
| Population | What you get | Filters change it? | Typical use |
| ---------------------- | ------------------------------------ | ------------------ | ------------------------------------------------------------------------------------------- |
| **All data** | Same total written onto every object | No | Share-of-whole maths with **Arithmetic** inside one model |
| **Current view** | Total for the filtered set | Yes | Totals that follow page filters and slices |
| **Dashboard constant** | One dashboard-level number | No | Stable denominators; ratios across models — see [Dashboard constants](#dashboard-constants) |
**All data** and **Current view** stamp the result onto each object in that data source.
**Dashboard constant** does not — it stores one scalar for the dashboard (shown with a
**constant** badge in the Calculated Fields list).
For share-of-whole inside one model, see
[Show each element's share of the whole](/analytics/dashboards/common-workflows#show-each-elements-share-of-the-whole).
### Unit conversion
Show a number in a different unit — for example feet to metres, or square feet to
square metres.
Pick the property, then choose a ready-made length or area conversion, or enter your
own multiplier. The unit label is for display only.
Use a Unit conversion field when other widgets, filters, or calculated fields should
consume the converted value. If you only need a different area unit or decimal places
on a Total or Ratio chart, use widget **Settings** → **Display unit** and **Rounding**
instead — see
[Aggregation and numeric display](/analytics/intelligence-dashboards#aggregation-and-numeric-display).
### Grouping
Inside **Grouping**, choose **Range groups** or **Value groups**.
Use **Range groups** when you have a number and want labels such as “under 10”, “10 to
50”, and “over 50”. Use **Value groups** when you have text (for example type names)
and want to roll several values into one label, such as “external walls”. Anything
outside your groups gets the fallback label you set.
### Null fallback
Use this when a property is sometimes blank and you still want a usable value in charts
and filters — for example show “Not set” when fire rating is missing.
Keep the property when it has a value. When it is empty or missing, show the
replacement you choose.
### Map lookup
Turn a code or short name on the model into a clearer label using a
[lookup table](/analytics/dashboards/lookup-tables). Pick the model property, the table,
the column to match, and the column to show. Unmatched values use your fallback.
You can import a CSV or Excel file from this dialog (**Import new table** if tables
already exist), or manage tables from **Lookup tables** in the sidebar.
### Logical
Label each element with your own words — for example “Compliant” / “Needs review” —
based on rules you set (the same kind of conditions you use in
[filters](/analytics/dashboards/filters)).
The element gets the pass label only when **every** condition is met. Otherwise it gets
the fail label. For full rulesets and detailed results, use
[Validation widgets](/analytics/dashboards/validation-widgets) instead.
### Coalesce
Use this when the same idea might live in different properties on different elements —
for example one model stores area under one name, another under a different name.
List the properties in order. Speckle uses the first one that has a value.
## Dashboard constants
A **Dashboard constant** is a special kind of [**Aggregate**](#aggregate): one total for
the whole dashboard, not a value written onto every object. In the editor, set
**Population** to **Dashboard constant**. The field shows a **constant** badge in the
Calculated Fields list.
Use it for totals that must stay put while people filter charts, or for X-per-Y figures
that mix two models (for example IT load per m² of IT room). Create one constant per
side, then divide them in **Ratio Value**, or in **Arithmetic** that only uses other
constants. Walkthrough:
[Show an X-per-Y number from two models](/analytics/dashboards/common-workflows#show-an-x-per-y-number-from-two-models).
Constants are worked out when your models have loaded and the field is on this
dashboard — not each time someone filters. Creating or editing a constant recalculates
it automatically.
Use constants in **Ratio Value** or **Total property value**. They are not listed next to Category
or Level in the shared property library, and they are not for group-by, colour-by, or element
filters.
Constants ignore chart and page filters, cannot depend on **Current view** fields, and add up
matching properties across **all** loaded models. Pick a property that only exists on the model
you mean. For totals that follow filters, use Aggregate **Current view**. For a different value on
every element, use a per-element field type instead.
## Use the field in your dashboard
Once the field is on this dashboard, treat it like any other property:
* Pick it when you set up a chart or table (what to total, what to group by, and so on)
* Use it in filters
* Use it to colour the model
**Dashboard constants** are the exception — see [Dashboard constants](#dashboard-constants).
Nothing is written back to Revit, Rhino, or the Speckle model. The value only exists
while you work in the dashboard.
## Build one field on top of another
You can create a second calculated field that uses the first one — for example convert
units first, then put the result into ranges.
If two fields depend on each other in a loop, Speckle will not let you save that setup.
An **Aggregate** field is one shared number for the whole data set. If you group a chart by that
field, you usually get a single group — that is expected.
## Things to watch out for
Calculated fields are still being exercised against every widget type. A field can look
fine in a table and look wrong in another widget. When something seems off, check the
combination below before trusting the number.
### Ratios and totals can “count twice”
Some widgets (including **Ratio Value** and **Ratio Value by Property**) work by adding
up a number **once per element**, then dividing.
An **All data** or **Current view** Aggregate already is a total — and that same total is
written onto every element. If a ratio widget adds it up per element, the result can be
far too large (roughly the real total multiplied by how many elements you have).
Safer patterns today:
* For “share of the whole” **inside one model**, use **Aggregate** (**All data** or
**Current view**) + **Arithmetic** as in
[Show each element's share of the whole](/analytics/dashboards/common-workflows#show-each-elements-share-of-the-whole)
— not that Aggregate field inside a Ratio widget.
* For a simple ratio of two **per-element** model properties, use the Ratio widgets with
the original model properties (or a **Unit conversion** / per-element **Arithmetic**
field).
* For a ratio of two **dashboard-level** totals (including across models), use
**Dashboard constant** aggregates in the Ratio widget — constants are not stamped per
object, so they do not get multiplied by element count. See
[Dashboard constants](#dashboard-constants).
On **Ratio Value** or **Total property value**, use
[Explain this value](#explain-this-value) to see whether a side is tagged **Fixed**,
**Current view**, or **Constant**, and what each stage contributed before the final
number.
### Arithmetic with a per-object denominator
A formula like `(fixedNumber / Area) * 100` looks like a percentage, and Arithmetic
will happily evaluate it per element. Each floor element produces something like
`(90000 / 500) * 100 = 18,000` — one result per element, not one ratio for the set.
When you drop that field into a metric widget set to **Sum**, the widget adds up every
element's individual ratio. With 27 floor elements the sum is roughly
`18,000 × 27 = 486,000` — not 32%.
**Use instead:**
* A **Dashboard constant** aggregate for the denominator, then reference it in
Arithmetic — constants produce one number for the dashboard and are not stamped per
object.
* The literal value if the denominator is known and fixed:
`(90000 / 277795) * 100` evaluates to the same constant on every element, so
**Average** gives the correct answer.
* **Average** aggregation (not Sum) when the ratio is truly the same on every element.
If a metric total looks far too large, open **Explain this value** (`?` on the widget)
and check whether the field stage is tagged **Current view** rather than **Constant**.
A **Current view** tag on what you expected to be a fixed denominator means the value
is stamped per object and will accumulate with Sum.
### Ratio filter targeting
**Ratio Value** and **Ratio Value by Property** let you choose which side of the fraction
filters affect. In the widget sidebar, **Apply filter to** (widget filters) and **Apply
global filter to** (page-level filters) each have four states:
| State | Effect |
| -------------- | --------------------------------------------- |
| **Off** | That filter is not applied to the ratio |
| **Part only** | Filters apply to the Part (numerator) only |
| **Total only** | Filters apply to the Total (denominator) only |
| **Both** | Filters apply to Part and Total (default) |
Use **Part only** when the numerator should be a filtered subset and the denominator
should stay the whole (for example completion-style ratios). Dashboard constants used as
operands stay filter-immune; targeting only affects property-based sides.
In **Single property** mode, Part vs Total targeting is what creates the two
populations. Setting both sides on or both sides off collapses that meaning — easy to
misread as bad data.
On **Ratio Value**, [Explain this value](#explain-this-value) shows filter chips per
side (**Applied — narrowing**, **Ignored**, **Off**, and related states), before/after
element counts where narrowing happens, and a note when active dashboard slices target
only one side of the ratio. **Ratio Value by Property** has the same **Apply filter to**
controls but does not yet offer Explain.
**Total property value** has special handling for Aggregate fields so it does not sum
the same total once per element. Do not assume every other widget does the same yet for
**All data** / **Current view** aggregates.
### Charts that group by an Aggregate field
Because every element shares the same **All data** or **Current view** Aggregate value,
a chart grouped by that field usually shows **one** bar or category. That is expected.
Group by a normal property (or a **Grouping** / **Map lookup** field) instead. Dashboard
constants are not object properties, so they are not used as group-by fields in the same
way.
### Cross-model totals need dashboard constants
On a dashboard with more than one model (more than one Model Viewer / data source),
**All data** and **Current view** aggregates are calculated **inside each model
separately**. You cannot take a stamped total from model A and use it as a per-object
input on model B.
To combine totals across models — for example rack IT load from one model and IT room
area from another — create **Dashboard constant** fields for each side and divide them
in Ratio Value or in Arithmetic that only references those constants. See
[Dashboard constants](#dashboard-constants).
### Renames break existing widgets
Charts, filters, and colour-by remember the field **name**. Rename the field, and those
widgets need to be pointed at the new name again.
### Not for writing back to the model
Calculated fields are analysis-only. They do not appear as editable parameters in
[Parameter Updater](/beta/parameter-updater).
### Check the numbers
Until the Beta settles, spot-check important dashboards: compare a calculated total to
**Total property value** on the same property, or to a known figure from the model.
If a ratio or total looks impossibly large or tiny, look for an Aggregate field used
where a per-element value was expected. For a guided walkthrough of the built-in
checks, see [Debugging and validating values](#debugging-and-validating-values).
## Debugging and validating values
When a calculated number looks wrong, work from the quickest check to the most detailed.
Only some widgets expose a full explanation today.
### Live preview in the calculated field editor
While you create or edit a field (left sidebar → **Calculated Fields** → open the
field), most expression types show a **live preview** against loaded model data:
* Input values and the resulting value for one sample object
* A **dice** control to pick another random sample when more than one object qualifies
* A short reason when preview cannot run (for example missing property mapping, no
loaded data, or a dashboard constant that has not been computed yet)
For **Range groups**, the editor also shows a **Distribution** chart of the source
property across loaded objects, so you can see whether your bands cover the values you
expect.
The editor also blocks save when required options are missing or invalid (highlighted
controls). Fix those before trusting any widget that uses the field.
### Explain this value
On **Ratio Value** and **Total property value**, in **edit** mode, open the **?**
(**Explain this value**) action on the widget card. The dialog shows how the live
number was produced from the widget’s current filters and dashboard slices — not an
unfiltered dashboard-wide sample.
| Resource scope | Where the field is defined | On this dashboard |
| -------------- | -------------------------------------------- | ------------------------------------- |
| **Dashboard** | Only this dashboard (default) | Ready as soon as you save |
| **Project** | Shared across dashboards in the same project | Click **Use on this dashboard** first |
| **Workspace** | Shared across dashboards in the workspace | Click **Use on this dashboard** first |
While calculated fields are in **Beta**, project- and workspace-scoped fields have **no overwrite
protection**. If two people edit the same shared field, the last save wins — there is no merge,
conflict warning, or version history. There is also **no syncing between scopes**: changing a
field’s scope does not keep copies in other scopes up to date, and fields defined at different
scopes stay separate.
* **Remove from this dashboard** — stop using a project- or workspace-scoped field here; it stays in
the library.
* **Delete from library** — remove a project- or workspace-scoped field so other dashboards cannot
use it either.
* **Delete field** — remove a dashboard-scoped field.
## Choose what the field should do
You do not need to know formulas or spreadsheet functions. Pick the option that matches
what you want the dashboard to show.
| I want to… | Choose |
| ------------------------------------------------------------- | ------------------------------- |
| Do simple maths or compare two numbers | **Arithmetic** |
| Get one total, average, or count for the whole set | **Aggregate** |
| Change units (for example feet to metres) | **Unit conversion** |
| Put numbers into labelled ranges (small / medium / large) | **Grouping** → **Range groups** |
| Put text values into custom groups | **Grouping** → **Value groups** |
| Fill in a blank when a property is missing | **Null fallback** |
| Swap a code or name for a friendlier label from a list | **Map lookup** |
| Mark each element as pass or fail with my own labels | **Logical** |
| Try several properties and use the first one that has a value | **Coalesce** |
These names match the tabs in the editor.
### Arithmetic
Add, subtract, multiply, or divide values from the model — for example combine two
areas, or check whether one number is larger than another.
You write a short formula with letters such as `a` and `b`, then tell Speckle which
model property each letter means. If a value is missing, the result is blank.
**Arithmetic works element by element.** If your formula divides a fixed number by a per-object
property — for example `(90000 / Area) * 100` — each element gets its own result. Summing those
per-element ratios gives `value × element count`, not a meaningful percentage.
To get one ratio for the whole dataset:
* Bind the denominator to a **Dashboard constant** aggregate — constants are not stamped
per object, so the ratio stays correct under any aggregation.
* Use the literal value directly: `(90000 / 277795) * 100` — every element gets the same
constant result, and **Average** aggregation returns the correct figure.
* Change the widget aggregation to **Average** when every element genuinely shares the
same ratio.
Arithmetic can also bind [dashboard constants](#dashboard-constants) (scalars) so formulas stay
stable when people filter the dashboard. A **Dashboard constant** Aggregate can source from a
per-object calculated field when you need a masked or conditional total as a scalar. See the
warning above if your formula divides a fixed number by a per-object property.
### Aggregate
Get one figure for the whole data set — for example a total area or an average height —
not a different number on every element.
Choose a **Population**:
| Population | What you get | Filters change it? | Typical use |
| ---------------------- | ------------------------------------ | ------------------ | ------------------------------------------------------------------------------------------- |
| **All data** | Same total written onto every object | No | Share-of-whole maths with **Arithmetic** inside one model |
| **Current view** | Total for the filtered set | Yes | Totals that follow page filters and slices |
| **Dashboard constant** | One dashboard-level number | No | Stable denominators; ratios across models — see [Dashboard constants](#dashboard-constants) |
**All data** and **Current view** stamp the result onto each object in that data source.
**Dashboard constant** does not — it stores one scalar for the dashboard (shown with a
**constant** badge in the Calculated Fields list).
For share-of-whole inside one model, see
[Show each element's share of the whole](/analytics/dashboards/common-workflows#show-each-elements-share-of-the-whole).
### Unit conversion
Show a number in a different unit — for example feet to metres, or square feet to
square metres.
Pick the property, then choose a ready-made length or area conversion, or enter your
own multiplier. The unit label is for display only.
Use a Unit conversion field when other widgets, filters, or calculated fields should
consume the converted value. If you only need a different area unit or decimal places
on a Total or Ratio chart, use widget **Settings** → **Display unit** and **Rounding**
instead — see
[Aggregation and numeric display](/analytics/intelligence-dashboards#aggregation-and-numeric-display).
### Grouping
Inside **Grouping**, choose **Range groups** or **Value groups**.
Use **Range groups** when you have a number and want labels such as “under 10”, “10 to
50”, and “over 50”. Use **Value groups** when you have text (for example type names)
and want to roll several values into one label, such as “external walls”. Anything
outside your groups gets the fallback label you set.
### Null fallback
Use this when a property is sometimes blank and you still want a usable value in charts
and filters — for example show “Not set” when fire rating is missing.
Keep the property when it has a value. When it is empty or missing, show the
replacement you choose.
### Map lookup
Turn a code or short name on the model into a clearer label using a
[lookup table](/analytics/dashboards/lookup-tables). Pick the model property, the table,
the column to match, and the column to show. Unmatched values use your fallback.
You can import a CSV or Excel file from this dialog (**Import new table** if tables
already exist), or manage tables from **Lookup tables** in the sidebar.
### Logical
Label each element with your own words — for example “Compliant” / “Needs review” —
based on rules you set (the same kind of conditions you use in
[filters](/analytics/dashboards/filters)).
The element gets the pass label only when **every** condition is met. Otherwise it gets
the fail label. For full rulesets and detailed results, use
[Validation widgets](/analytics/dashboards/validation-widgets) instead.
### Coalesce
Use this when the same idea might live in different properties on different elements —
for example one model stores area under one name, another under a different name.
List the properties in order. Speckle uses the first one that has a value.
## Dashboard constants
A **Dashboard constant** is a special kind of [**Aggregate**](#aggregate): one total for
the whole dashboard, not a value written onto every object. In the editor, set
**Population** to **Dashboard constant**. The field shows a **constant** badge in the
Calculated Fields list.
Use it for totals that must stay put while people filter charts, or for X-per-Y figures
that mix two models (for example IT load per m² of IT room). Create one constant per
side, then divide them in **Ratio Value**, or in **Arithmetic** that only uses other
constants. Walkthrough:
[Show an X-per-Y number from two models](/analytics/dashboards/common-workflows#show-an-x-per-y-number-from-two-models).
Constants are worked out when your models have loaded and the field is on this
dashboard — not each time someone filters. Creating or editing a constant recalculates
it automatically.
Use constants in **Ratio Value** or **Total property value**. They are not listed next to Category
or Level in the shared property library, and they are not for group-by, colour-by, or element
filters.
Constants ignore chart and page filters, cannot depend on **Current view** fields, and add up
matching properties across **all** loaded models. Pick a property that only exists on the model
you mean. For totals that follow filters, use Aggregate **Current view**. For a different value on
every element, use a per-element field type instead.
## Use the field in your dashboard
Once the field is on this dashboard, treat it like any other property:
* Pick it when you set up a chart or table (what to total, what to group by, and so on)
* Use it in filters
* Use it to colour the model
**Dashboard constants** are the exception — see [Dashboard constants](#dashboard-constants).
Nothing is written back to Revit, Rhino, or the Speckle model. The value only exists
while you work in the dashboard.
## Build one field on top of another
You can create a second calculated field that uses the first one — for example convert
units first, then put the result into ranges.
If two fields depend on each other in a loop, Speckle will not let you save that setup.
An **Aggregate** field is one shared number for the whole data set. If you group a chart by that
field, you usually get a single group — that is expected.
## Things to watch out for
Calculated fields are still being exercised against every widget type. A field can look
fine in a table and look wrong in another widget. When something seems off, check the
combination below before trusting the number.
### Ratios and totals can “count twice”
Some widgets (including **Ratio Value** and **Ratio Value by Property**) work by adding
up a number **once per element**, then dividing.
An **All data** or **Current view** Aggregate already is a total — and that same total is
written onto every element. If a ratio widget adds it up per element, the result can be
far too large (roughly the real total multiplied by how many elements you have).
Safer patterns today:
* For “share of the whole” **inside one model**, use **Aggregate** (**All data** or
**Current view**) + **Arithmetic** as in
[Show each element's share of the whole](/analytics/dashboards/common-workflows#show-each-elements-share-of-the-whole)
— not that Aggregate field inside a Ratio widget.
* For a simple ratio of two **per-element** model properties, use the Ratio widgets with
the original model properties (or a **Unit conversion** / per-element **Arithmetic**
field).
* For a ratio of two **dashboard-level** totals (including across models), use
**Dashboard constant** aggregates in the Ratio widget — constants are not stamped per
object, so they do not get multiplied by element count. See
[Dashboard constants](#dashboard-constants).
On **Ratio Value** or **Total property value**, use
[Explain this value](#explain-this-value) to see whether a side is tagged **Fixed**,
**Current view**, or **Constant**, and what each stage contributed before the final
number.
### Arithmetic with a per-object denominator
A formula like `(fixedNumber / Area) * 100` looks like a percentage, and Arithmetic
will happily evaluate it per element. Each floor element produces something like
`(90000 / 500) * 100 = 18,000` — one result per element, not one ratio for the set.
When you drop that field into a metric widget set to **Sum**, the widget adds up every
element's individual ratio. With 27 floor elements the sum is roughly
`18,000 × 27 = 486,000` — not 32%.
**Use instead:**
* A **Dashboard constant** aggregate for the denominator, then reference it in
Arithmetic — constants produce one number for the dashboard and are not stamped per
object.
* The literal value if the denominator is known and fixed:
`(90000 / 277795) * 100` evaluates to the same constant on every element, so
**Average** gives the correct answer.
* **Average** aggregation (not Sum) when the ratio is truly the same on every element.
If a metric total looks far too large, open **Explain this value** (`?` on the widget)
and check whether the field stage is tagged **Current view** rather than **Constant**.
A **Current view** tag on what you expected to be a fixed denominator means the value
is stamped per object and will accumulate with Sum.
### Ratio filter targeting
**Ratio Value** and **Ratio Value by Property** let you choose which side of the fraction
filters affect. In the widget sidebar, **Apply filter to** (widget filters) and **Apply
global filter to** (page-level filters) each have four states:
| State | Effect |
| -------------- | --------------------------------------------- |
| **Off** | That filter is not applied to the ratio |
| **Part only** | Filters apply to the Part (numerator) only |
| **Total only** | Filters apply to the Total (denominator) only |
| **Both** | Filters apply to Part and Total (default) |
Use **Part only** when the numerator should be a filtered subset and the denominator
should stay the whole (for example completion-style ratios). Dashboard constants used as
operands stay filter-immune; targeting only affects property-based sides.
In **Single property** mode, Part vs Total targeting is what creates the two
populations. Setting both sides on or both sides off collapses that meaning — easy to
misread as bad data.
On **Ratio Value**, [Explain this value](#explain-this-value) shows filter chips per
side (**Applied — narrowing**, **Ignored**, **Off**, and related states), before/after
element counts where narrowing happens, and a note when active dashboard slices target
only one side of the ratio. **Ratio Value by Property** has the same **Apply filter to**
controls but does not yet offer Explain.
**Total property value** has special handling for Aggregate fields so it does not sum
the same total once per element. Do not assume every other widget does the same yet for
**All data** / **Current view** aggregates.
### Charts that group by an Aggregate field
Because every element shares the same **All data** or **Current view** Aggregate value,
a chart grouped by that field usually shows **one** bar or category. That is expected.
Group by a normal property (or a **Grouping** / **Map lookup** field) instead. Dashboard
constants are not object properties, so they are not used as group-by fields in the same
way.
### Cross-model totals need dashboard constants
On a dashboard with more than one model (more than one Model Viewer / data source),
**All data** and **Current view** aggregates are calculated **inside each model
separately**. You cannot take a stamped total from model A and use it as a per-object
input on model B.
To combine totals across models — for example rack IT load from one model and IT room
area from another — create **Dashboard constant** fields for each side and divide them
in Ratio Value or in Arithmetic that only references those constants. See
[Dashboard constants](#dashboard-constants).
### Renames break existing widgets
Charts, filters, and colour-by remember the field **name**. Rename the field, and those
widgets need to be pointed at the new name again.
### Not for writing back to the model
Calculated fields are analysis-only. They do not appear as editable parameters in
[Parameter Updater](/beta/parameter-updater).
### Check the numbers
Until the Beta settles, spot-check important dashboards: compare a calculated total to
**Total property value** on the same property, or to a known figure from the model.
If a ratio or total looks impossibly large or tiny, look for an Aggregate field used
where a per-element value was expected. For a guided walkthrough of the built-in
checks, see [Debugging and validating values](#debugging-and-validating-values).
## Debugging and validating values
When a calculated number looks wrong, work from the quickest check to the most detailed.
Only some widgets expose a full explanation today.
### Live preview in the calculated field editor
While you create or edit a field (left sidebar → **Calculated Fields** → open the
field), most expression types show a **live preview** against loaded model data:
* Input values and the resulting value for one sample object
* A **dice** control to pick another random sample when more than one object qualifies
* A short reason when preview cannot run (for example missing property mapping, no
loaded data, or a dashboard constant that has not been computed yet)
For **Range groups**, the editor also shows a **Distribution** chart of the source
property across loaded objects, so you can see whether your bands cover the values you
expect.
The editor also blocks save when required options are missing or invalid (highlighted
controls). Fix those before trusting any widget that uses the field.
### Explain this value
On **Ratio Value** and **Total property value**, in **edit** mode, open the **?**
(**Explain this value**) action on the widget card. The dialog shows how the live
number was produced from the widget’s current filters and dashboard slices — not an
unfiltered dashboard-wide sample.
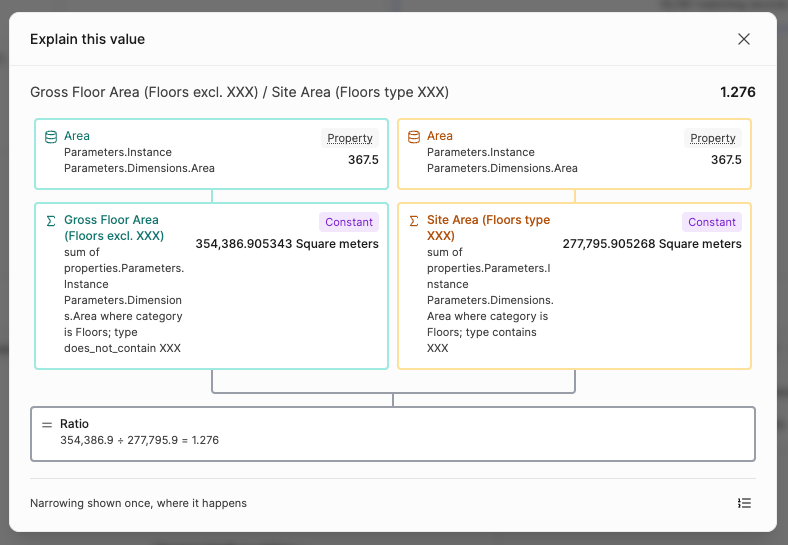 You get:
* A banner when dashboard slices are active (titles and selected values)
* A stage flow for sources, calculated fields, aggregates, filters/slices, and the
final combine step
* Tags for value sources (**Fixed**, **Current view**, **Constant**) and for how
filters apply on each side
* Narrowing counts once where filters actually reduce the element set
(`total → matched`)
* Status notes when something is empty, null-only, divide-by-zero, missing a field
reference, or using an **inferred scope** (self-division that silently drops
elements without a declared filter)
* An insight note when active slices affect only one side of a ratio
* Optional **plain text summary** (list icon) you can copy
Click a clickable stage to jump to the calculated-field editor or the widget filter
UI for that step.
**Ratio Value by Property** does not have this action yet. Use filter targeting in the
sidebar and the live preview on the field instead.
### Filters, slices, and scenarios
Wrong numbers are often filter state, not bad maths:
* On ratio widgets, check **Apply filter to** and **Apply global filter to** (see
[Ratio filter targeting](#ratio-filter-targeting)).
* On **Total property value**, **Apply global filters** turns page-level slices on or
off for that widget.
* Active slices appear in the filter bar. [Scenarios](/analytics/dashboards/sharing#scenarios)
restore named filter and colour-by snapshots; they do not change calculated-field
definitions, but they do change which elements feed widgets that respect those
filters.
If a **Ratio Value** settles on no usable result, the card can show **Invalid** (for
example divide by zero) — open Explain to see which stage failed.
## FAQ
Start in the calculated field editor: check the live sample preview (and the
**Distribution** chart for Range groups). Then check filter targeting, the filter
bar, and any active [scenario](/analytics/dashboards/sharing#scenarios). On **Ratio
Value** or **Total property value**, open **Explain this value** (**?**) for the
stage flow, narrowing counts, and filter chips. Spot-check against **Total property
value** or a known model figure. Full walkthrough:
[Debugging and validating values](#debugging-and-validating-values).
No. Calculated fields only exist in the dashboard. They are not published back to
the model.
Check that it appears under **On this dashboard**. If it is only in **Shared
library**, click **Use on this dashboard**. Then open the chart settings and pick
the field by the name you gave it.
Charts and filters remember the old name. Open the widget settings and choose the
field again under its new name.
Not with calculated fields. They are for analysis in the dashboard. To edit real
model parameters and send changes back, see
[Parameter Updater](/beta/parameter-updater).
Check whether a numerator or denominator is an **All data** or **Current view**
Aggregate. Ratio widgets often add values once per element, which can multiply an
already-totalled field. Use original model properties, build the share with
**Aggregate** + **Arithmetic**, or use **Dashboard constant** aggregates when both
sides are dashboard-level totals — see
[Things to watch out for](#things-to-watch-out-for) and
[Dashboard constants](#dashboard-constants).
The most common cause is a formula with a per-object denominator summed across many
elements. For example `(90000 / Area) * 100` with aggregation **Sum** adds up one
ratio per element — with 27 elements each returning \~18,000, the total is \~486,000.
Try one of these:
* Switch aggregation to **Average** if every element should carry the same ratio.
* Replace the property binding with a **Dashboard constant** aggregate so the
denominator is one shared number, not a per-element value.
* Use the literal denominator directly if it is a known fixed number:
`(90000 / 277795) * 100` gives a constant result that aggregates correctly.
Open **Explain this value** (`?` on the widget) and look at the field stage tag:
**Current view** means the value is re-stamped per object; **Constant** means it is a
single dashboard-level number. See
[Arithmetic with a per-object denominator](#arithmetic-with-a-per-object-denominator).
Yes, with **Dashboard constants**. Create a constant for each model’s total, then
divide them in **Ratio Value** or in Arithmetic that only references those
constants. Ordinary **All data** / **Current view** aggregates still stay inside
each model’s objects — see
[Dashboard constants](#dashboard-constants).
That is intentional. Dashboard constants are filter-immune so denominators stay
fixed while people explore. Use Aggregate with **Current view** when the total
should follow filters.
Kind of yes, and kind of no. Both let you set conditions on model properties. Use
**Logical** when you want a label you can put in a table, chart, filter, or another
calculated field — and when your two outcomes are not necessarily “Pass” and
“Fail” (for example “Compliant” / “Needs review”).
Use **Property Checker** (see
[Validation widgets](/analytics/dashboards/validation-widgets)) when you want a
dedicated validation view of the result. **Logical** does not explain *why* an
element got its label or break down how that outcome was reached; Property Checker
is built for that kind of review.
## See also
* [Filters](/analytics/dashboards/filters) — Focus the dashboard on part of the model
* [Lookup tables](/analytics/dashboards/lookup-tables) — Import lists for **Map lookup** and validation
* [Common workflows](/analytics/dashboards/common-workflows#show-each-elements-share-of-the-whole) — Share of the whole with Aggregate and Arithmetic
* [Common workflows](/analytics/dashboards/common-workflows#show-an-x-per-y-number-from-two-models) — An X-per-Y number from two models
* [Common workflows](/analytics/dashboards/common-workflows#turn-model-codes-into-clear-labels-for-charts) — Codes to clear labels with lookup tables and Map lookup
* [Intelligence Dashboards](/analytics/intelligence-dashboards) — Overview and widgets
You get:
* A banner when dashboard slices are active (titles and selected values)
* A stage flow for sources, calculated fields, aggregates, filters/slices, and the
final combine step
* Tags for value sources (**Fixed**, **Current view**, **Constant**) and for how
filters apply on each side
* Narrowing counts once where filters actually reduce the element set
(`total → matched`)
* Status notes when something is empty, null-only, divide-by-zero, missing a field
reference, or using an **inferred scope** (self-division that silently drops
elements without a declared filter)
* An insight note when active slices affect only one side of a ratio
* Optional **plain text summary** (list icon) you can copy
Click a clickable stage to jump to the calculated-field editor or the widget filter
UI for that step.
**Ratio Value by Property** does not have this action yet. Use filter targeting in the
sidebar and the live preview on the field instead.
### Filters, slices, and scenarios
Wrong numbers are often filter state, not bad maths:
* On ratio widgets, check **Apply filter to** and **Apply global filter to** (see
[Ratio filter targeting](#ratio-filter-targeting)).
* On **Total property value**, **Apply global filters** turns page-level slices on or
off for that widget.
* Active slices appear in the filter bar. [Scenarios](/analytics/dashboards/sharing#scenarios)
restore named filter and colour-by snapshots; they do not change calculated-field
definitions, but they do change which elements feed widgets that respect those
filters.
If a **Ratio Value** settles on no usable result, the card can show **Invalid** (for
example divide by zero) — open Explain to see which stage failed.
## FAQ
Start in the calculated field editor: check the live sample preview (and the
**Distribution** chart for Range groups). Then check filter targeting, the filter
bar, and any active [scenario](/analytics/dashboards/sharing#scenarios). On **Ratio
Value** or **Total property value**, open **Explain this value** (**?**) for the
stage flow, narrowing counts, and filter chips. Spot-check against **Total property
value** or a known model figure. Full walkthrough:
[Debugging and validating values](#debugging-and-validating-values).
No. Calculated fields only exist in the dashboard. They are not published back to
the model.
Check that it appears under **On this dashboard**. If it is only in **Shared
library**, click **Use on this dashboard**. Then open the chart settings and pick
the field by the name you gave it.
Charts and filters remember the old name. Open the widget settings and choose the
field again under its new name.
Not with calculated fields. They are for analysis in the dashboard. To edit real
model parameters and send changes back, see
[Parameter Updater](/beta/parameter-updater).
Check whether a numerator or denominator is an **All data** or **Current view**
Aggregate. Ratio widgets often add values once per element, which can multiply an
already-totalled field. Use original model properties, build the share with
**Aggregate** + **Arithmetic**, or use **Dashboard constant** aggregates when both
sides are dashboard-level totals — see
[Things to watch out for](#things-to-watch-out-for) and
[Dashboard constants](#dashboard-constants).
The most common cause is a formula with a per-object denominator summed across many
elements. For example `(90000 / Area) * 100` with aggregation **Sum** adds up one
ratio per element — with 27 elements each returning \~18,000, the total is \~486,000.
Try one of these:
* Switch aggregation to **Average** if every element should carry the same ratio.
* Replace the property binding with a **Dashboard constant** aggregate so the
denominator is one shared number, not a per-element value.
* Use the literal denominator directly if it is a known fixed number:
`(90000 / 277795) * 100` gives a constant result that aggregates correctly.
Open **Explain this value** (`?` on the widget) and look at the field stage tag:
**Current view** means the value is re-stamped per object; **Constant** means it is a
single dashboard-level number. See
[Arithmetic with a per-object denominator](#arithmetic-with-a-per-object-denominator).
Yes, with **Dashboard constants**. Create a constant for each model’s total, then
divide them in **Ratio Value** or in Arithmetic that only references those
constants. Ordinary **All data** / **Current view** aggregates still stay inside
each model’s objects — see
[Dashboard constants](#dashboard-constants).
That is intentional. Dashboard constants are filter-immune so denominators stay
fixed while people explore. Use Aggregate with **Current view** when the total
should follow filters.
Kind of yes, and kind of no. Both let you set conditions on model properties. Use
**Logical** when you want a label you can put in a table, chart, filter, or another
calculated field — and when your two outcomes are not necessarily “Pass” and
“Fail” (for example “Compliant” / “Needs review”).
Use **Property Checker** (see
[Validation widgets](/analytics/dashboards/validation-widgets)) when you want a
dedicated validation view of the result. **Logical** does not explain *why* an
element got its label or break down how that outcome was reached; Property Checker
is built for that kind of review.
## See also
* [Filters](/analytics/dashboards/filters) — Focus the dashboard on part of the model
* [Lookup tables](/analytics/dashboards/lookup-tables) — Import lists for **Map lookup** and validation
* [Common workflows](/analytics/dashboards/common-workflows#show-each-elements-share-of-the-whole) — Share of the whole with Aggregate and Arithmetic
* [Common workflows](/analytics/dashboards/common-workflows#show-an-x-per-y-number-from-two-models) — An X-per-Y number from two models
* [Common workflows](/analytics/dashboards/common-workflows#turn-model-codes-into-clear-labels-for-charts) — Codes to clear labels with lookup tables and Map lookup
* [Intelligence Dashboards](/analytics/intelligence-dashboards) — Overview and widgets