

When to use the SDK vs connector components
The Speckle Grasshopper connector (Publish, Load, passthrough nodes) is the right tool for moving data to and from Speckle. SpeckleSharp in a C# Script is the right tool when you need:- Custom analysis that connector nodes do not provide
- Extracting or restructuring model data programmatically
- Creating reports with computed fields derived from geometry
- Combining Speckle data with Grasshopper logic in one pass
- Prototyping workflows before turning them into a plugin or automation
When connector nodes are enough
Passthrough nodes move and lightly edit data on wires. They do not execute graph-wide computation, derive per-element metadata from geometry, or assemble nested collections from grouping rules. Deconstruct inspects one param at a time; Speckle.Sdk constructs and analyses the whole graph; Publish exchanges it.Ecosystem progression
Solid lines = main guide. Dotted = ecosystem / appendix only.
Mission and when you need the SDK
Passthrough nodes move geometry and attach static attributes. They do not run graph-wide computation or build nested structures from rules. The use cases above cover when to reach for Speckle.Sdk in a C# Script.The same workflow applies to room footprints (
floorArea, occupancy, carbonEstimate,
qaStatus) or any case where per-element computed fields do not scale on wires.Prerequisites
- Rhino 8 and a Grasshopper C# Script component (Maths > Script)
- Familiarity with Developer Nodes — especially Deconstruct for the inspect layer
- Awareness that Publish exists on the connector (exchange layer) — not required to complete this exercise
- DataObject and Collection — the containers this guide builds
Set up the C# Script component
Add a C# Script to your canvas and declare these inputs and outputs. Geometry comes from Grasshopper; Speckle-facing metadata is computed in the script, not wired in as static lists.
Do not add
category or loads as dumb inputs — those values are derived in code.
Install packages and minimal bootstrap
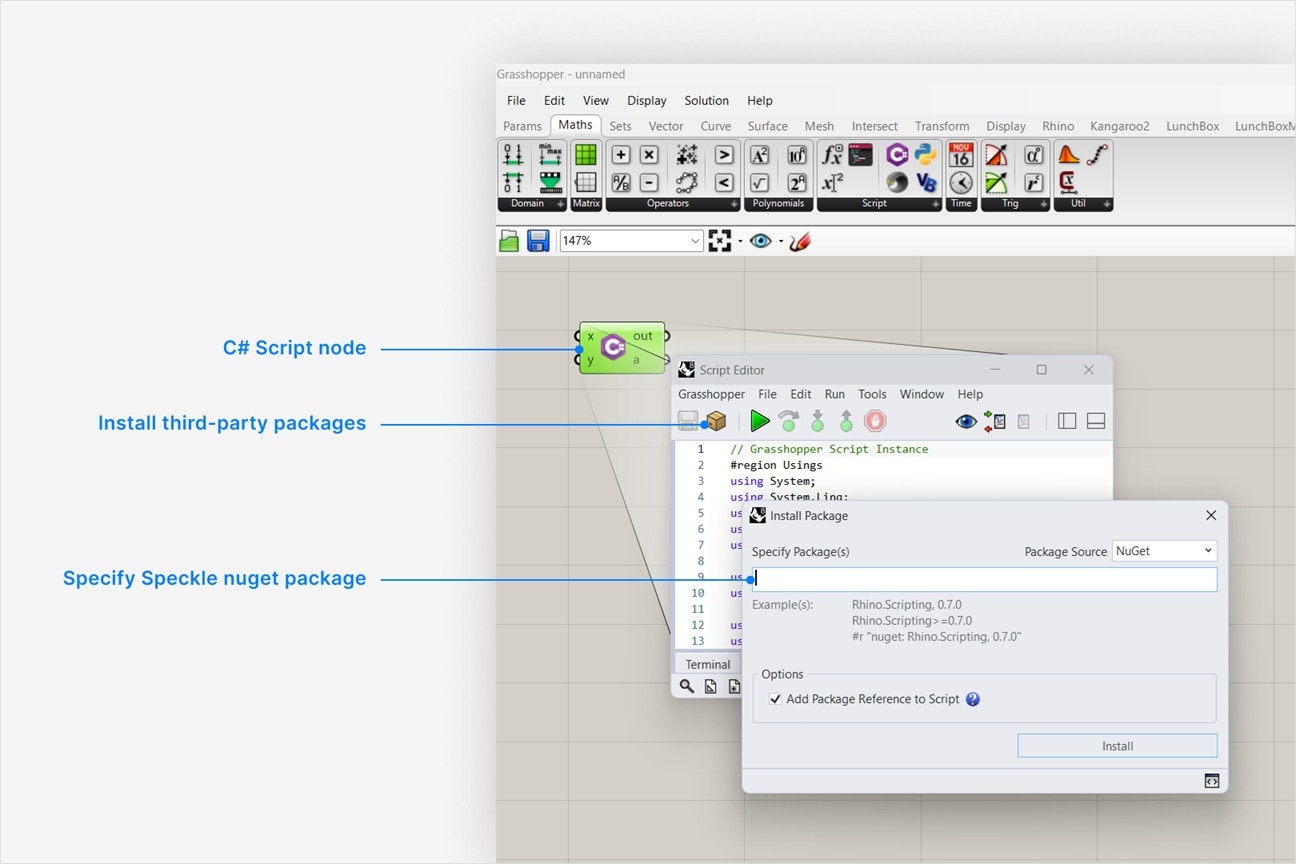
Install NuGet packages from the C# Script editor (box icon > Specify Package(s)). Copy the#r lines from the Speckle.Sdk and Speckle.Objects Script & Interactive tabs (version numbers will match the latest release):
NuGet references

Flatten helpers plus optional Serialize — no account or IClientFactory required for the main exercise:
Bootstrap
Grasshopper execution model
Grasshopper recomputes the script whenever upstream inputs change. Building aCollection of a few hundred DataObject instances is cheap — there is no network call in the main exercise.
On large lists, cache the summary string in a script field and only rebuild it when pts count changes, so preview panels stay responsive. The object graph itself should still rebuild each solve so outputs stay correct.
Enrich a structural layout
Worked example: build a publish-ready structural data model from pier locations and grid lines. Inputs are geometry only; every Speckle property below is computed.Complete example
Complete example
1
Put geometry on `displayValue`
Convert each Rhino
Point3d to a Speckle Point and assign it to DataObject.displayValue. The viewer and connector expect renderable geometry here — the same field Deconstruct reads on a published param.In the script, BuildFooting creates specklePoint and sets displayValue = new List<Base> { specklePoint }. Each footing DataObject now carries geometry the viewer can render.2
Compute properties on each `DataObject`
Store BIM-like fields in
DataObject.properties, not on the root Base indexer. Derive every field from point position, grid proximity, and capacity — that is the justification for code over passthrough nodes.After this step, each footing has computed keys such as distanceFromOrigin, quadrant, bearing, utilization, and nearestGridLine in its properties dictionary.3
Group footings into a `Collection` hierarchy
Nest footings into child collections by computed
quadrant. Collection.elements mirrors how Create Collection nodes organize a canvas — except the grouping rule runs in C#.BuildRootByQuadrant returns a root Collection named Structural layout with one child collection per quadrant. The full graph is ready to traverse.4
Inspect the graph locally
Call
Use this to sanity-check property names and nesting before exchange. See Load and publish model data.When
root.Flatten() to count every Base in the graph and wire elementCount. Build summary from aggregated computed fields. Optionally preview JSON:Optional — Serialize for JSON preview
Optional — Serialize for JSON preview
Example
status reads OK, elementCount matches the flattened graph and summary reports footing counts and average utilization.DataObject / Collection graph and a trustworthy summary. When you are ready to exchange it, use Publish on the connector (normal workflow) or Appendix A (programmatic). Do not rebuild the same graph with Collection nodes on the canvas.
Extend the graph
Nested collections by rule — the example already groups byquadrant. Swap the GroupBy key for nearestGridLine or a utilization band to change hierarchy without new inputs.
Line geometry between pairs — add Speckle Line objects to displayValue or as sibling DataObject entries:
Example
floorArea from AreaMassProperties and store it on properties the same way as distanceFromOrigin.
See Working with Geometry for mesh and unit details.
How this relates to the Speckle Grasshopper connector
When connector nodes are enough, use them for transport and light edits. Speckle.Sdk in a C# Script is for graph-wide computation, derived per-element metadata, and nested collections from programmatic rules. Deconstruct inspects one param at a time; Speckle.Sdk constructs and analyses the whole graph; Publish exchanges it. Both paths use the same object model (DataObject, Collection, displayValue). The connector casts native Grasshopper geometry through wrapper types; your script converts explicitly — same serialized shape on the wire.
Production connector code lives in speckle-sharp-connectors under Speckle.Connectors.GrasshopperShared and Speckle.Converters.RhinoShared.
Common pitfalls
Next Steps
Objects and Traversal
DataObject, Collection, displayValue
Automate with scripts
Send2 when ready to publish
Operations API
Send2 and Receive2 signatures
Related documentation
Developer Nodes
Deconstruct and inspect published params
Grasshopper Objects
Passthrough geometry and static attributes
Collections
Canvas-side collection hierarchy
Objects and traversal
DataObject, Collection, Flatten
Automate with scripts
Send2 / Receive2 when you need transport from code
Grasshopper connector
Publish and Load on the canvas
Appendices
A. Publish the same graph from code
A. Publish the same graph from code
If you already built See Load and publish model data and Authentication (Appendix C).
root in the script and need to send it without the Publish component, add account bootstrap and follow Automate with scripts:Example
B. Fetch and query after Load
B. Fetch and query after Load
After Load on the connector, traverse received graphs with Find objects by property. Server access requires Authentication.
C. Authentication
C. Authentication
PATs, environment variables, and desktop accounts: Authentication. Only needed for appendices A and B — not for the main data-modelling exercise.